Static Heatmaps
In addition to interactive treeview interface, Cluster analysis results are also available as static annotated heatmaps saved in pdf files. The values represented by heatmaps correspond to log transformed ratios.
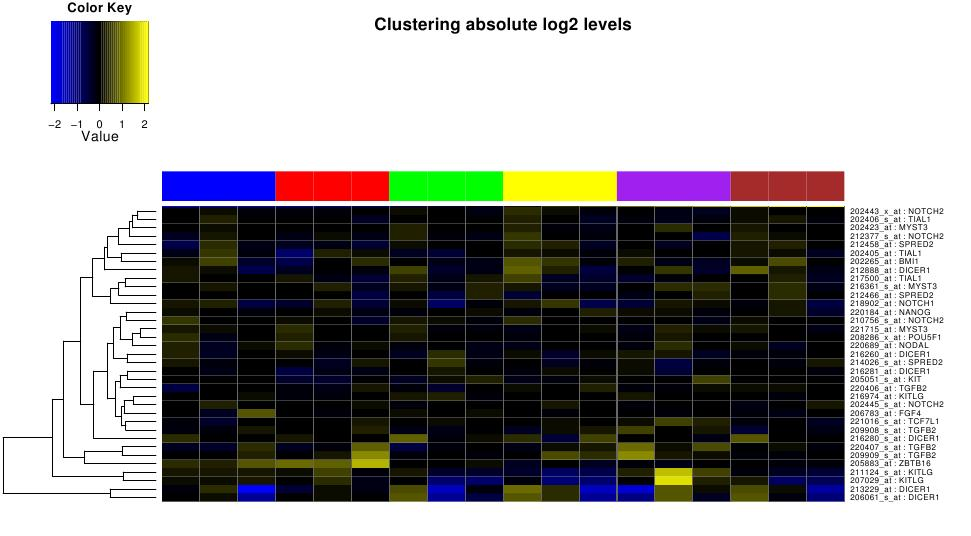
Figure: Static heatmap for stem cell genes
The figure above illustrates static heatmap clustered on selected stem cell genes across 6 treatment types. These sample annotations are provided separately in the link "legend for all the heatmaps'' as shown in figure.
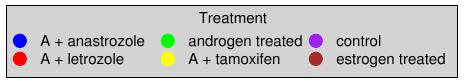
Figure: legend for 6 treatment types
Created with the Personal Edition of HelpNDoc: News and information about help authoring tools and software