Statistical Analysis
For the selected samples in the dataset, we can identify differentially expressed significant genes. Values represented by heatmaps correspond to average expression levels for the same sample subgrouping. Red box in the left sidebar indicates p-value less than 0.05.
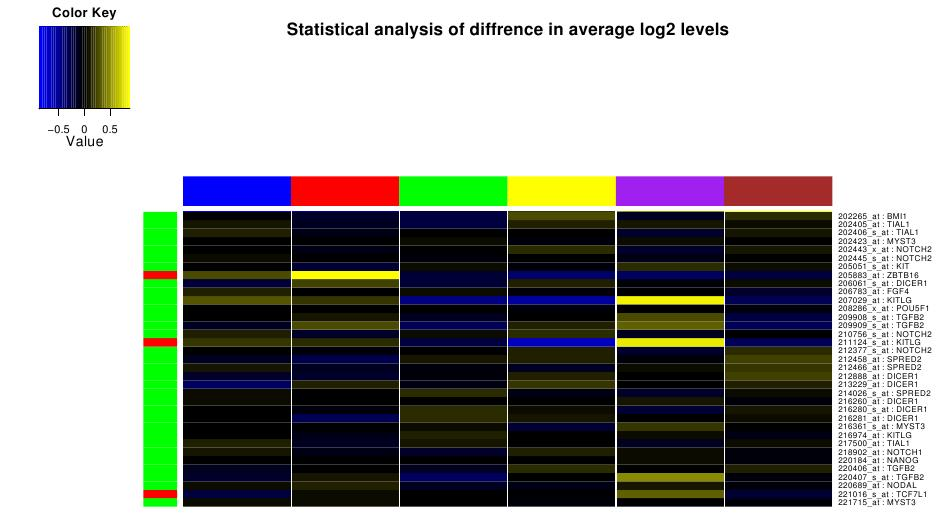
Figure: Statistical Analysis of stem cell genes
Created with the Personal Edition of HelpNDoc: Full-featured EPub generator