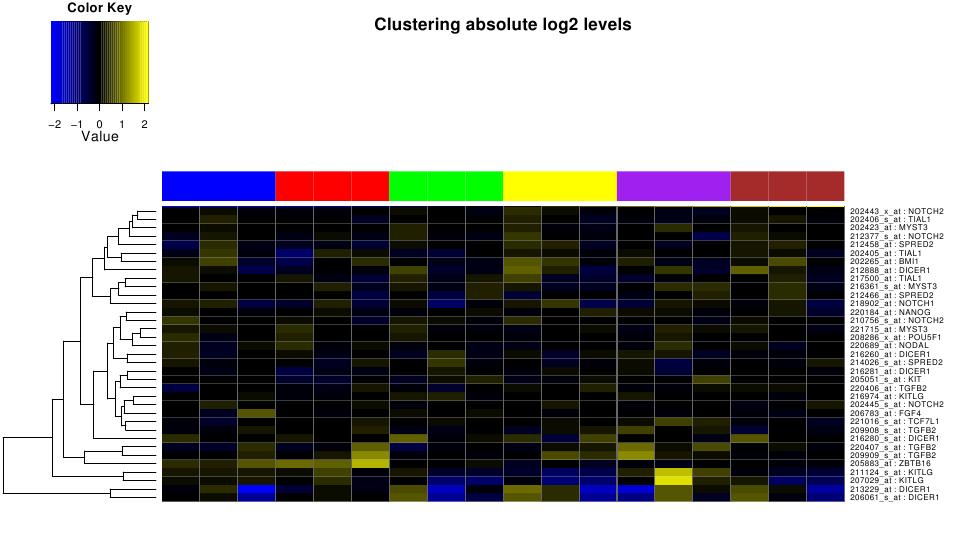
In addition to interactive treeview interface, Cluster analysis results are also available as static annotated heatmaps saved in pdf files. The values represented by heatmaps correspond to log transformed ratios.
Figure ![[*]](crossref.png) illustrates static heatmap
clustered on selected stem cell genes across 6 treatment types. These
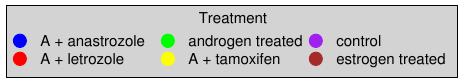
sample annotations are provided separately in the link ``legend
for all the heatmaps'' as shown in figure .
illustrates static heatmap
clustered on selected stem cell genes across 6 treatment types. These
sample annotations are provided separately in the link ``legend
for all the heatmaps'' as shown in figure .